We are currently in the process of moving into a larger office space and finding furniture that will give the new office the look and feel we are going for. Naturally, I searched for different design options by googling office furniture using my Chrome Browser. Now, I can’t get rid of all of the office furniture ads that pop up regardless of what website I am visiting. That’s Google at work.
The fact that I now use the word Google as a noun, and that I personally rely on it like I rely on my eyes to see, is a testament to how embedded in our lives Google and googling has become. (I’m not even getting a spelling correction suggestion on the word ‘googling’)
We know the company changed its name to Alphabet (GOOG) (NASDAQ:GOOGL) a few years ago, but Google still makes up the majority of its revenues and profits, despite its alphabet soup of different products and services. Most of the ‘Other Bets’ are long shot investments with lots of idealistic upside potential but most of which will fail or fail to make much of an impact to the overall business. Luckily for Google, they have $100 billion in cash that allows them a few more than three strikeouts per inning as they swing for the fences. Investors that got in early have profited handsomely from its dominance of the search and ad business, but is it too late for anyone that missed the boat the first time?
If you haven’t invested in Alphabet yet and think it might be too late, think again. Here are several reasons why we think the company is still a Buy.
Cash
The company has $100 billion in cash and that can go a long way to finding the ‘next big thing’. It is focusing its efforts on the following:
- Research and Development spending alone is more than the market cap of the largest mid-cap company. Last year, the company spent $21 billion in R&D, primarily to capitalize on new trends like virtual reality, artificial intelligence, augmented reality, machine learning, 5G and quantum computing. With $100 billion in cash currently on the balance sheet, it could afford to invest aggressively even if many of the investments fall short of expectations. One home run puts the company on track for another long run.
- Hardware – The company is increasing its presence in hardware to manufacture its devices end-to-end, in response to preempt the threat of rising costs from 3rd party hardware manufacturers and ensure a seamless integration between its hardware and software. The Pixel, which is built on a lean, strong, non-bloated, version of Android, is a good machine and could lead to more direct competition with Samsung (OTC:SSNLF), potentially creating an Apple (NASDAQ:AAPL)-like opportunity for Alphabet. Do not discount the possibility that Alphabet gets heavier into hardware and potentially spins out such a company.
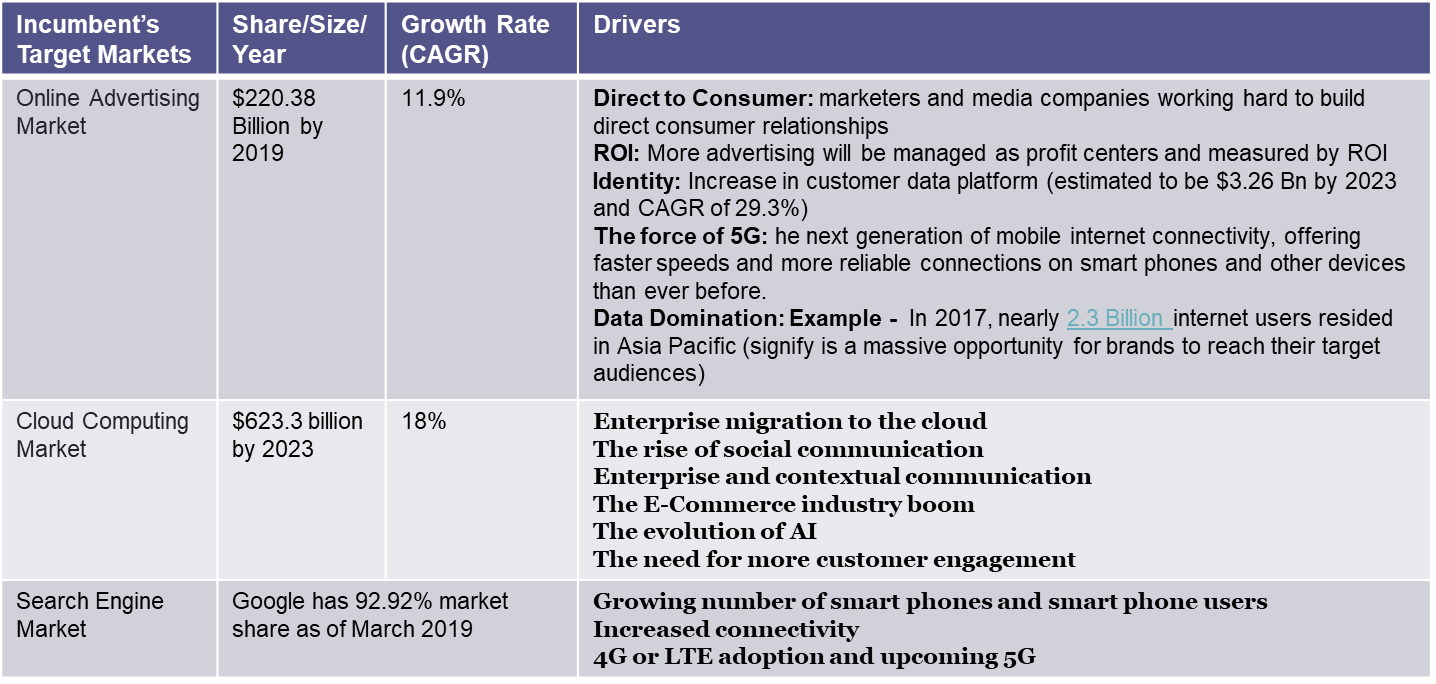
- Cloud – Google’s huge presence in the cloud industry lets it to tap into the growing markets within the cloud space. The cloud computing market is estimated to be worth $623.3 billion by 2023 and the cloud storage market to be worth $88.91 billion by 2022. It has the opportunity to expand the Google Cloud business in the enterprise market over the next 3 to 5 years. There is an opportunity to capture market share and the market will likely continue to grow to accommodate IoT, edge computing and the “smart everything” world.
Growth
- Asia Pacific – According to analyst estimates, the Indian and Southeast Asian e-commerce market is expected to reach $150 billion by 2022 and $240 billion by 2025, respectively. And growth in Indian digital commerce is a huge opportunity for payment processing and the industry is expected to reach $1+ trillion by 2025. Google launched mobile payments platform Tez in India in September 2017. The payments industry is also expected to reach $200 billion in Southeast Asia. With Google having established a presence in these nascent markets, it is well positioned to take advantage of a significant revenue opportunity.
- Shared Mobility – Shared mobility market is estimated to be worth $619.51 billion by 2025 with a CAGR of 25.1% (of which Autonomous driving is estimated to be reach $556.67 billion by 2026 with a CAGR of 39.47%). Alphabet is considered to be the market leader with its offerings for autonomous driving and can establish itself as a major player in this space.
Online Search
Online Search and Advertising – Last but not least, Alphabet is still the leader in online advertising, deriving 87% of its revenue from online advertising. This revenue has been growing at a strong double-digit pace, which is driving double-digit earnings growth and is expected to continue to do so for at least five more years. The word Google is now commonly used as a verb when people have a question about something or are debating the facts about a topic. “Let me google it” is the de facto solution – the judge, the correct answer. The company’s 92.2% market share for internet search, including video content through YouTube, mobile OS, and internet search engines, is almost insulting to competitors considering how hard they are trying to steal market share. It has also launched Shopping Actions in an attempt to regain some of its control over product searches that have migrated to platforms like Amazon (NASDAQ:AMZN). Shopping Actions is a tool that integrates the retail experience across Google’s platforms (including mobile, desktop, and voice-powered devices). Early tests suggest that the project is increasing online shopping cart sizes by as much as 30%.
Google search technology is also contracted out to major online services and communications companies, giving it a massive moat that no competitor is close to challenging short term.
YouTube is a popular video viewing site with one billion hours viewed daily. That equates to 115,000 years of videos viewed daily. That large amount of viewership attracts advertisers to the site. And YouTube has entered the pay space which is directed at “cord cutters” and is now generating subscription revenue.
And let’s not forget the company’s database of information on all of us. It is overwhelming and would cost tens or hundreds of billions to replicate and could take years if not decades.
Return on Equity
But wait, there’s more. Many readers are familiar with Warren Buffett and his focus on Return of Equity. After all, if you’re buying the stock, you’re interested in the return you’re getting for investing in the equity of that company, right?
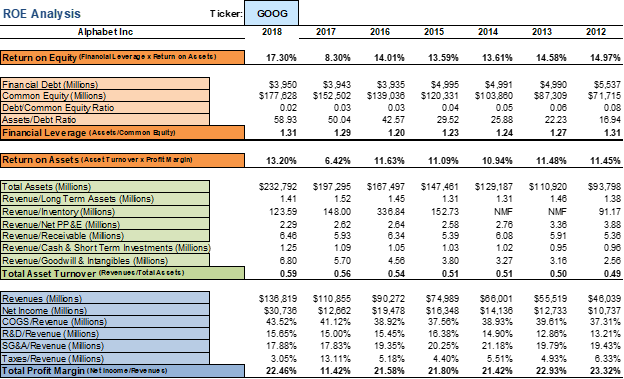
What strikes me as remarkable about the ROE for Alphabet is both it’s sustained level in the mid-teens and the remarkable consistency it has maintained over the last 5-6 years – especially for a mature Technology company. The analysis below indicates that ROE has fluctuated between 13% and 17% over the last 7 years with a only a brief dip into the high single digits in 2017.
The consistency has been pervasive throughout its business, and using the DuPont analysis, we see that all three drivers of ROE have been steady as well. Only profit margin decreased in 2017, which is why the ROE dropped to just over 8%. But other than that, financial leverage has remained in a tight range between 1.2 and 1.31. Asset Turnover has ranged from 0.49 to 0.59. And profit margins are consistently in the low 20s – except for 2017.
Valuation
After a 16% annualized return over the last 5 years, you might think the stock is due for a pause. But EPS is expected to grow by 6% in 2019 and then 17% in 2020. At a normalized PE ratio of 29, the stock would be trading at a price of over $1,325, a 13% gain at the time of this writing. If EPS growth of 17% in 2020 comes to fruition, the price is likely to break through $1,500 – and that is a conservative estimate based on no new home runs playing out in the short term.

According to 43 analysts providing price targets, Google is trading below even the most conservative target of $1,250 and well below the high estimate of $1,435. We rate the stock a strong buy.

If you enjoyed this article, please click on the “Follow” link at the top of the article.
![]()
ROI provides REIT ideas, high return opportunistic investments, and income generating ideas in dividend growth stocks, MLPs, BDCs, baby bonds, ETFs and Closed-end funds.
Detailed articles on some of our best ideas mentioned in this article can be found HERE, and they are updated regularly.
We also provide a number of Excel Spreadsheets such as the ROI Portfolio Dashboard and the Market Dashboard, which provides a daily view of stocks, bonds, commodities, and currencies.
More tools to come.
Try it two-weeks for FREE
Start a free trial now.
Disclosure: I am/we are long GOOG. I wrote this article myself, and it expresses my own opinions. I am not receiving compensation for it (other than from Seeking Alpha). I have no business relationship with any company whose stock is mentioned in this article.
Additional disclosure: This article is meant to identify an idea for further research and analysis and should not be taken as a recommendation to invest. It does not provide individualized advice or recommendations for any specific reader. Also note that we may not cover all relevant risks related to the ideas presented in this article. Readers should conduct their own due diligence and carefully consider their own investment objectives, risk tolerance, time horizon, tax situation, liquidity needs, and concentration levels, or contact their advisor to determine if any ideas presented here are appropriate for their unique circumstances.